How to View the Overview Dashboard on Shopify
The Shopify overview dashboard gives you plenty of benefits that you should take advantage of, similar to the finance reports. From it, you can view the value of your recent sales to compare with the previous period and compare how effective your sale channels are. In addition to that, you can monitor the trends. Thanks to these features, your online shop will be more developed and more professional.
Shopify is a platform that supports so many kinds of report features, you can even build your own custom report template if you want to. The overview dashboard is one of the reports that you want to keep your eyes on. It shows the most transparent metrics that demonstrate the current performance of your store, therefore I recommend you to take a look at it every week or at least every month. Below is a detailed instruction about how to view the overview dashboard for you to follow.
To view the overview dashboard on Shopify
Step 1: Go to Dashboards
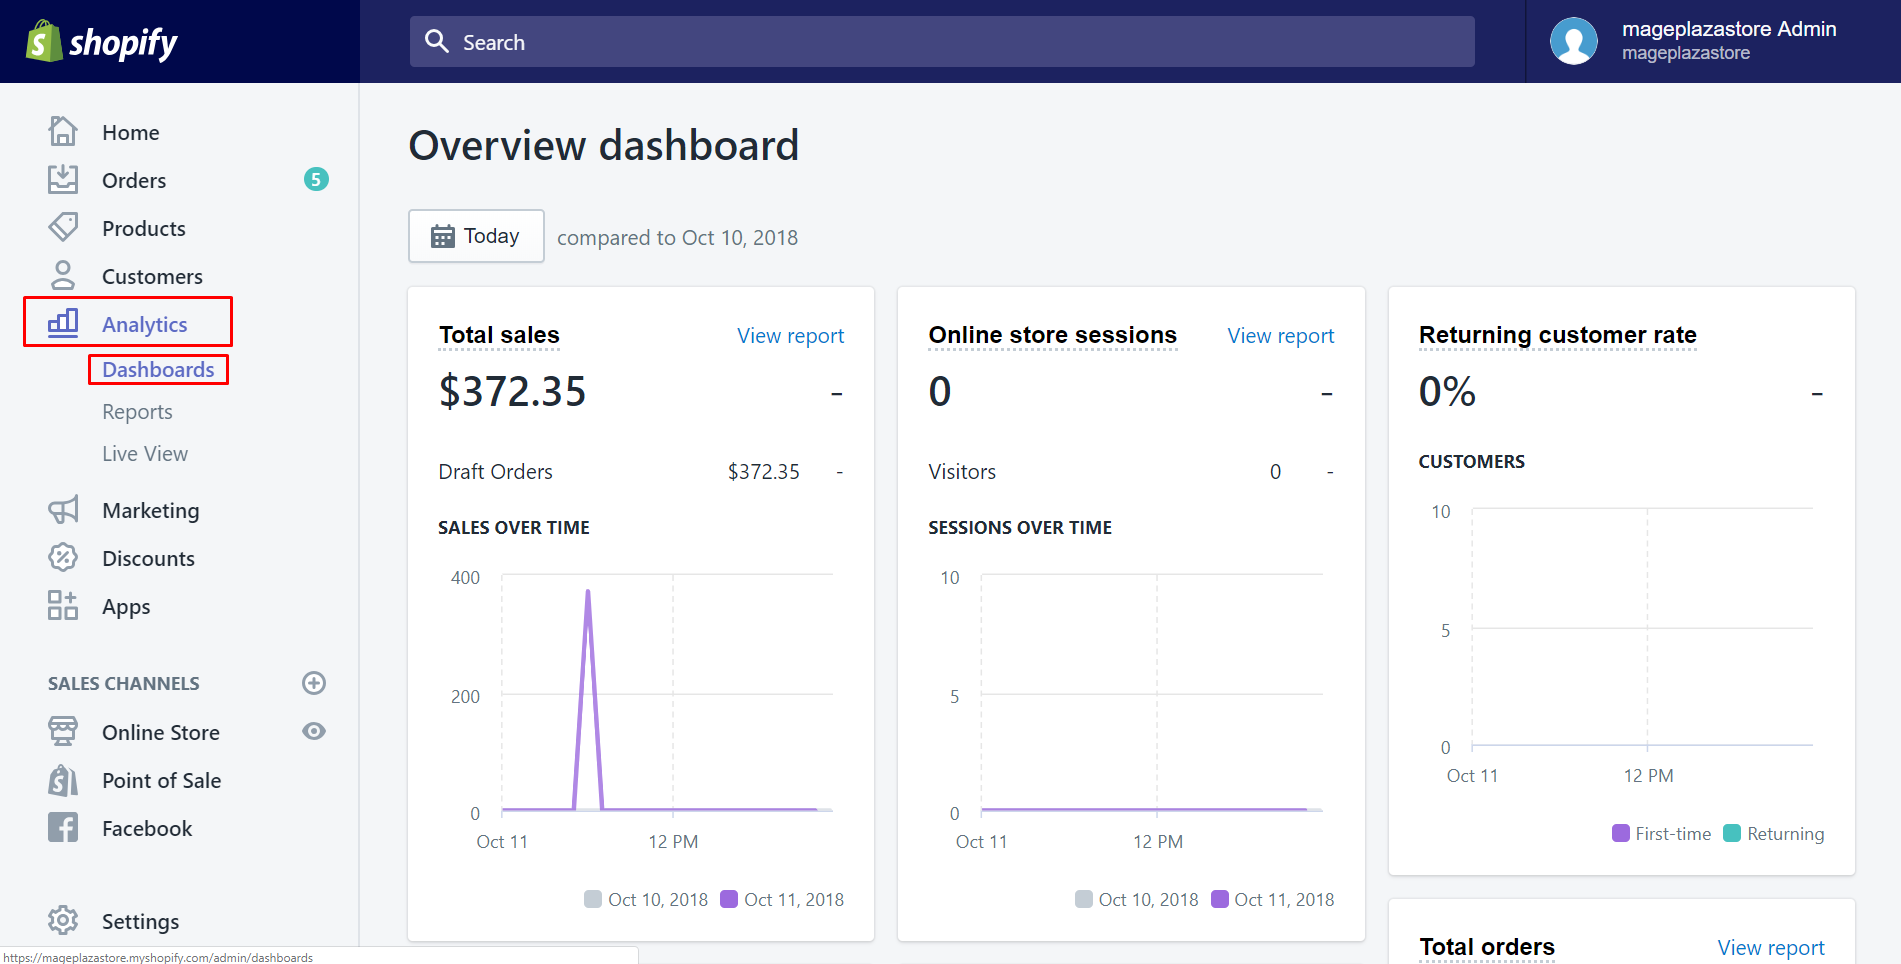
After logging in your Shopify account, click on Analytics which is on the left-hand side of the screen. Then, choose Dashboards. The dashboard is defaulted to show the data for the current day compared to the previous day.
Step 2: Select the date range
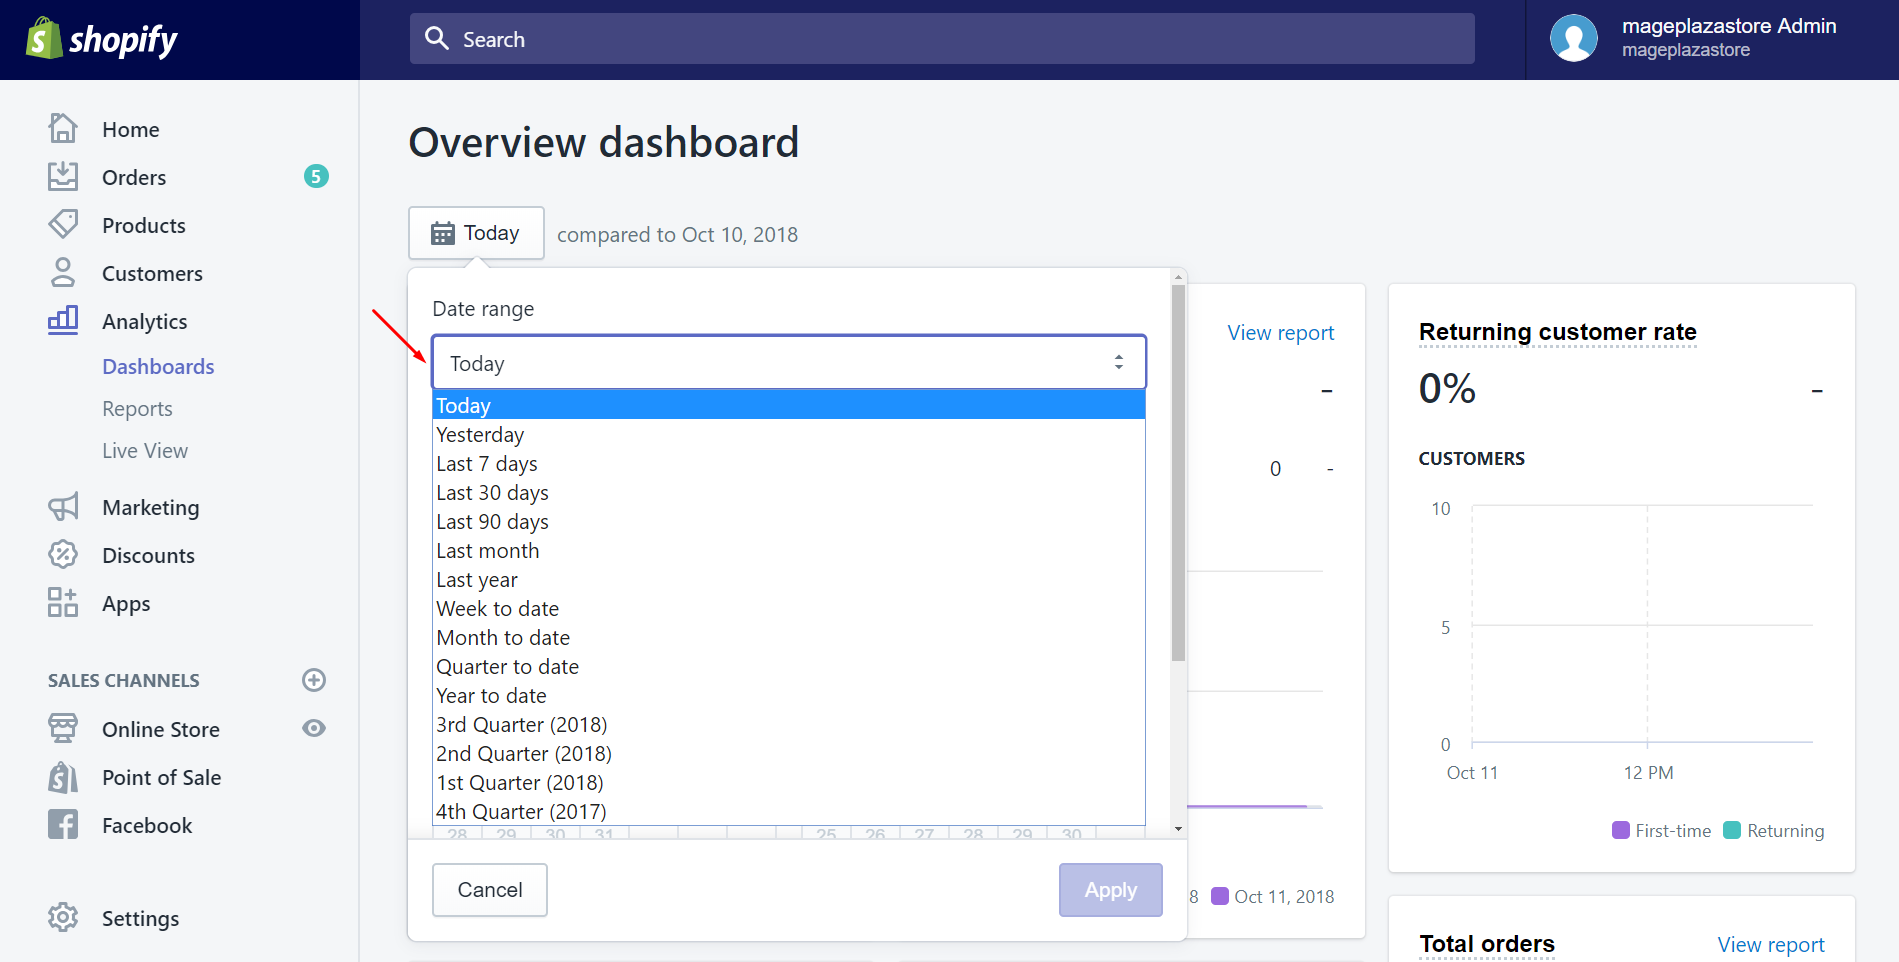
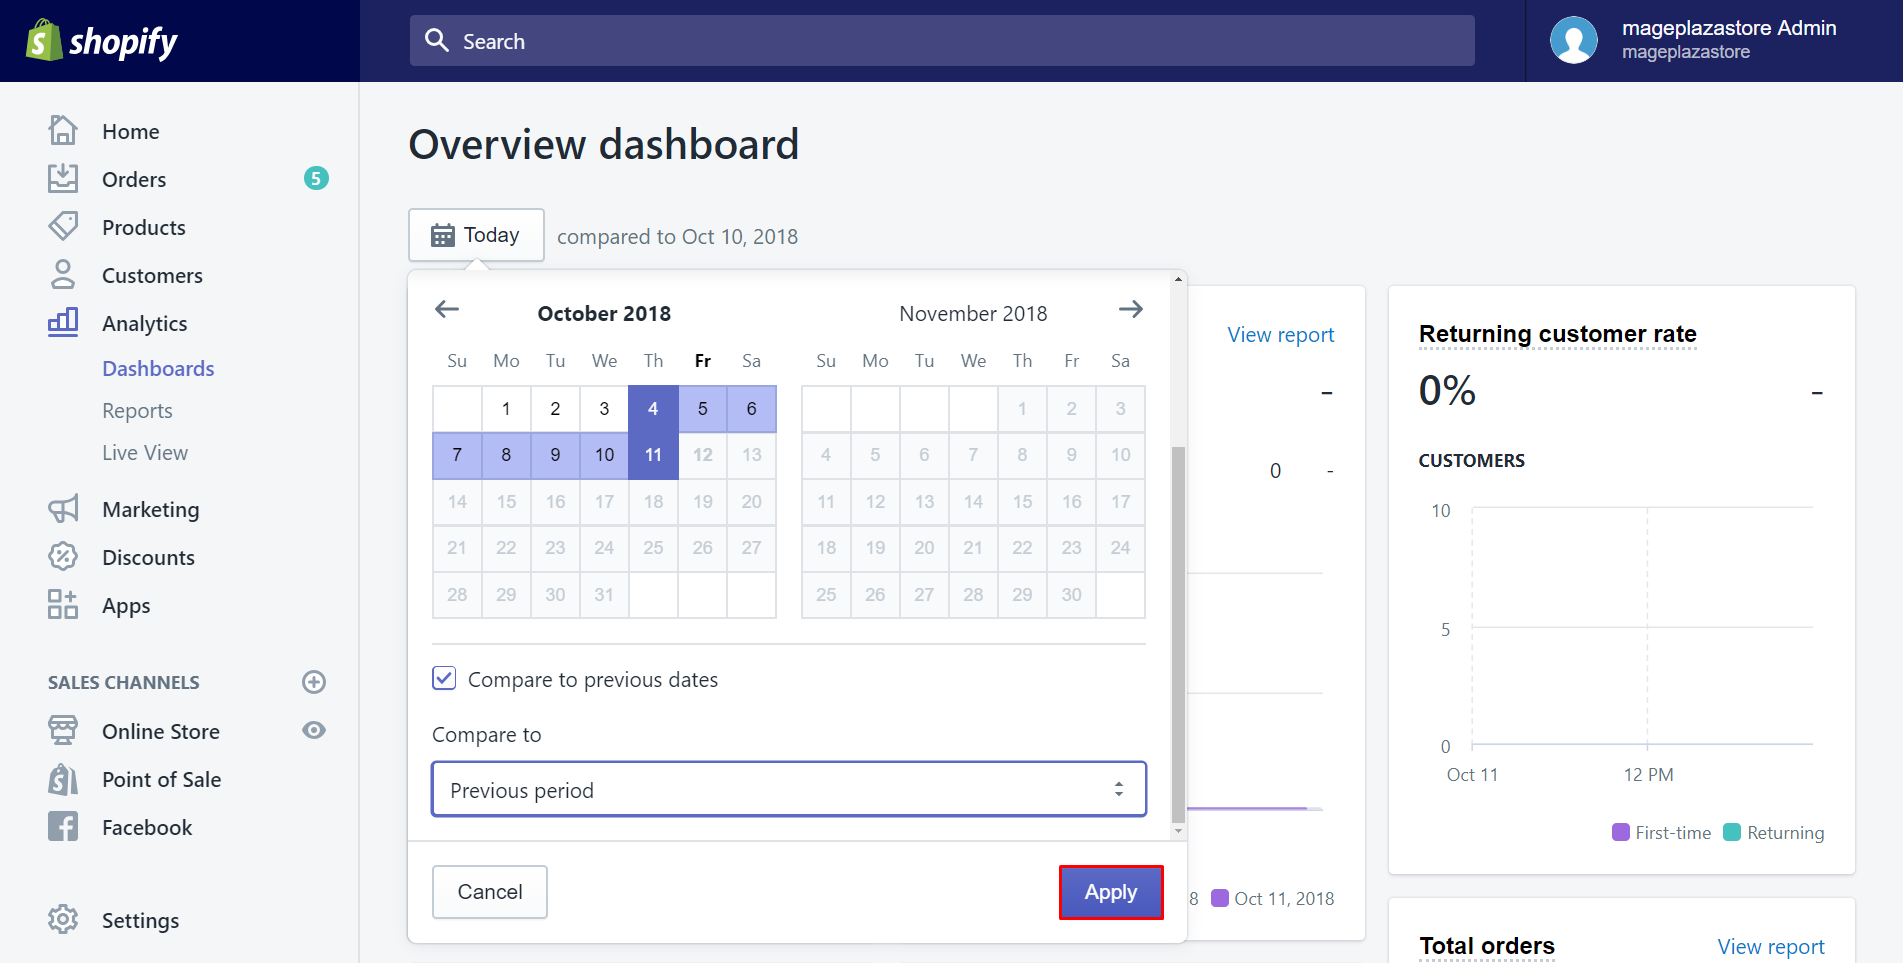
As I mentioned in the first step, the date is set by default. Hence, you may want to see the dashboard in a different date range. Fortunately, with Shopify, you can always set the date range that you want for any kind of reports. To do this, you can choose a preset range, for example, you select Last 7 days.
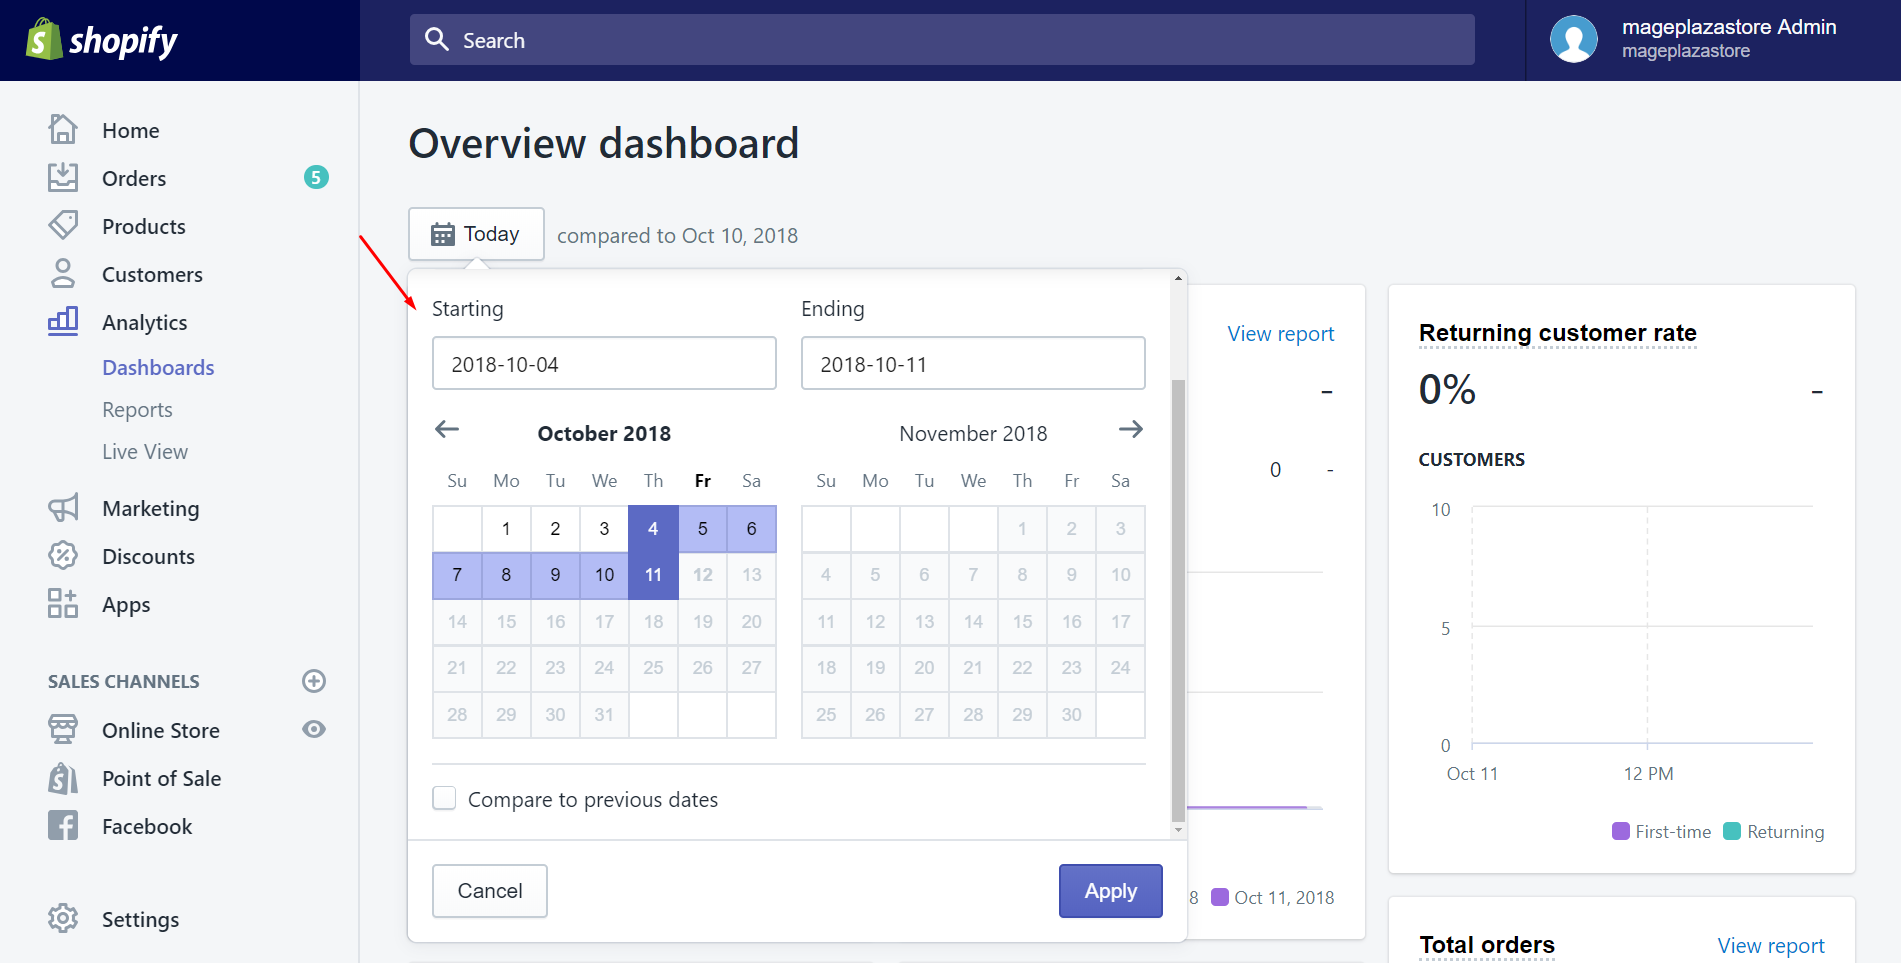
Or else, you customize the range by selecting dates on the calendars.
Step 3: Check Compare to previous dates
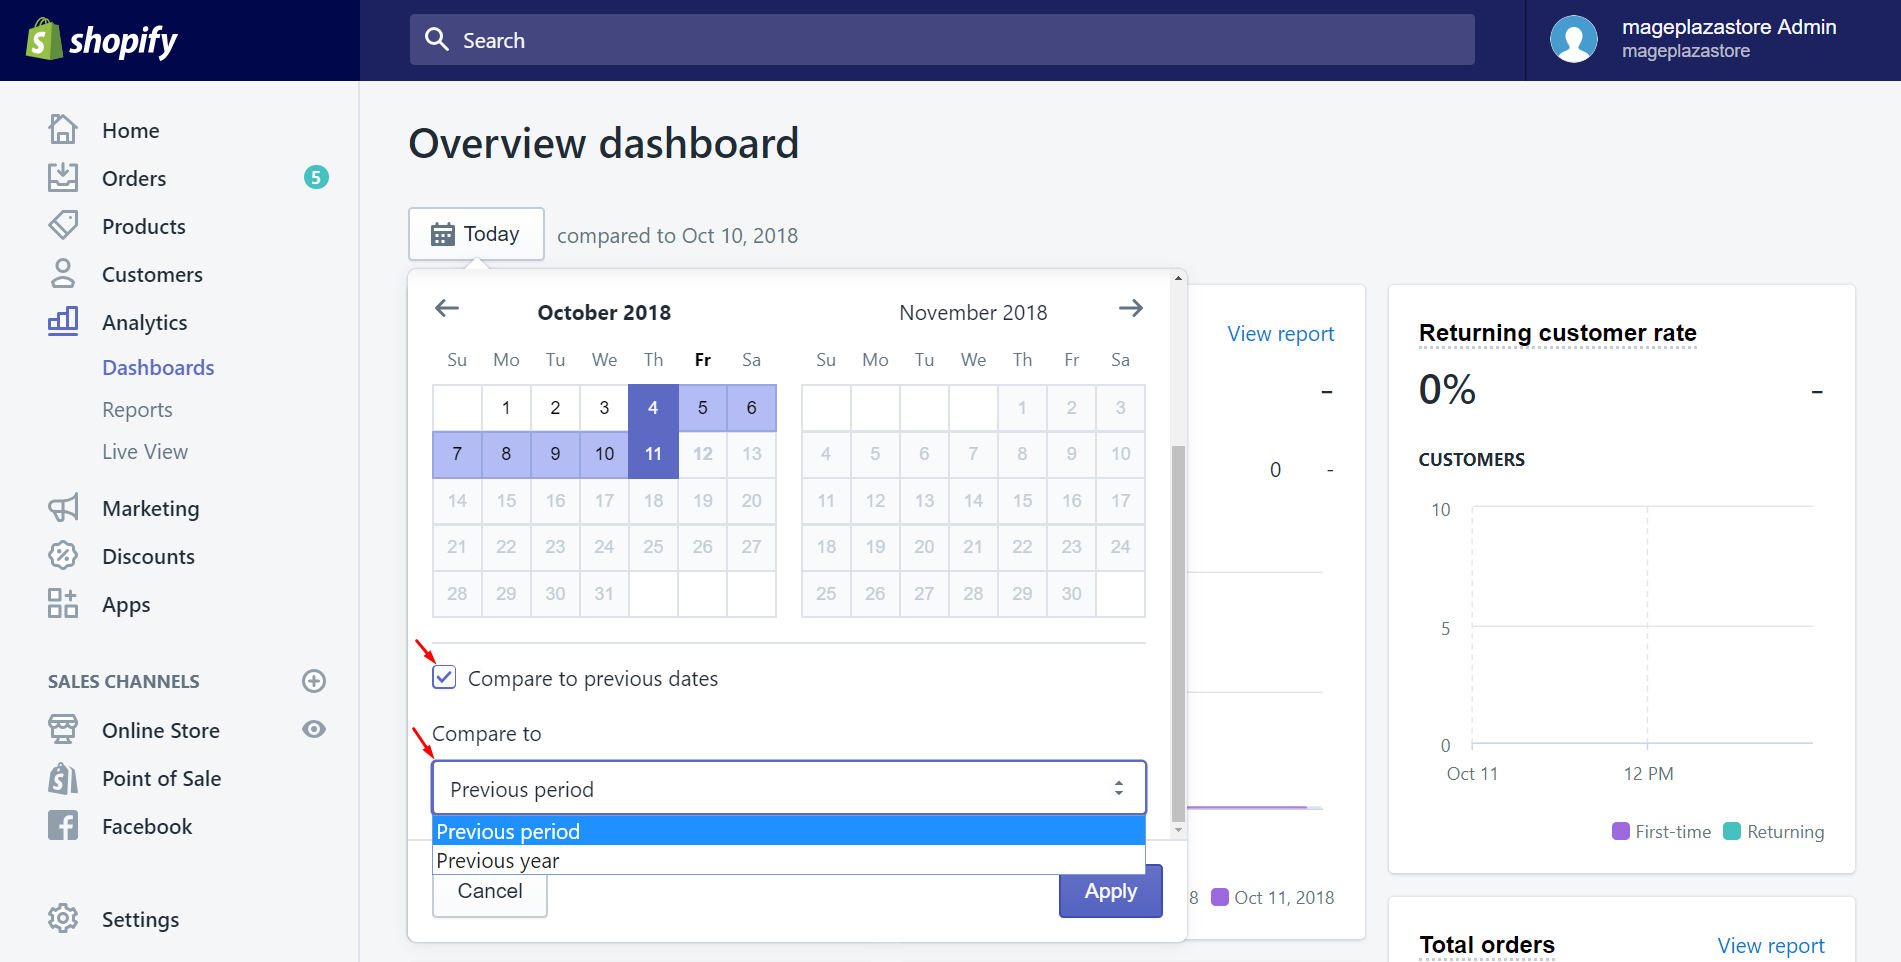
In this step, Shopify provides you with a helpful feature to compare the recent sales and the previous ones. If you prefer to compare the current sales to the previous period or the same date range in the previous year, make sure to check Compare to previous dates and choose the value of comparison.
Step 4: View all metrics
Afterward, click on Apply to view all the most valuable metrics which are shown in numeric format and graphs.
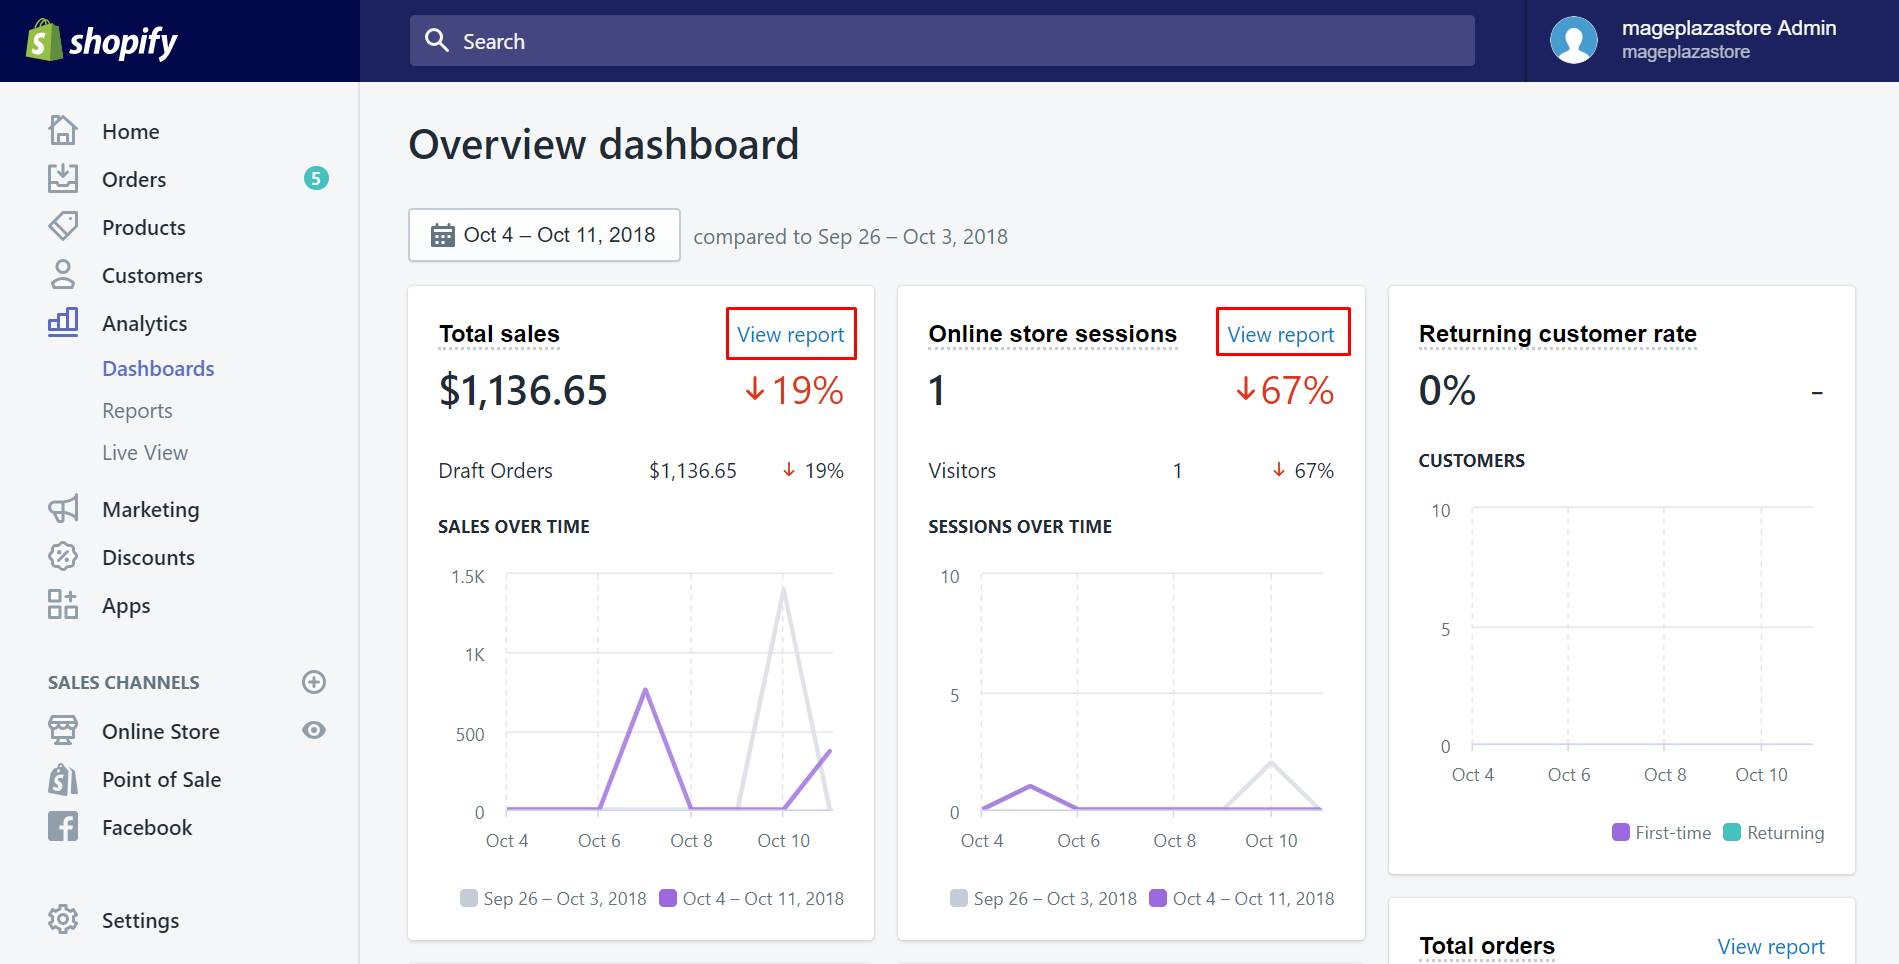
Step 5: (Optional) Get the Detailed Report
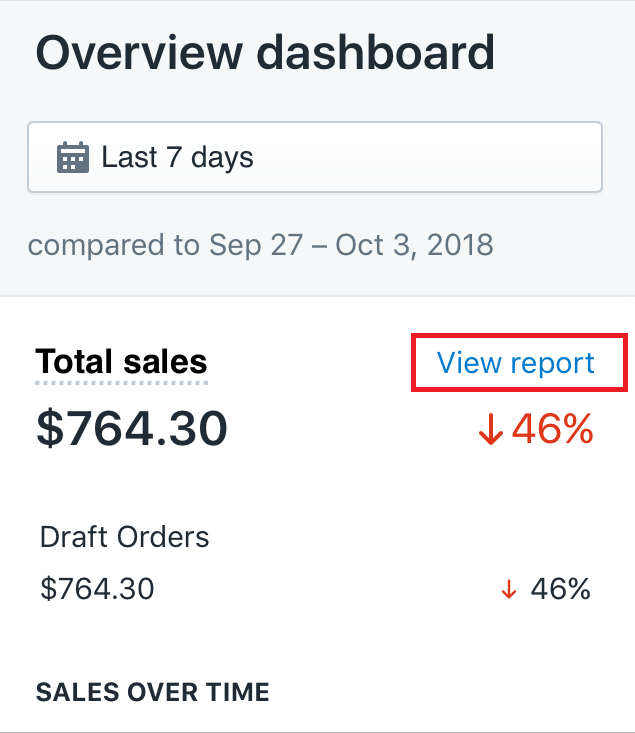
If you want to look deeper into any specific metrics, say, total sales, you can click the View report button to access the detailed report for that metric. It’s worth mentioning that not all metrics have a detailed report so don’t worry if you don’t see any button like that.
To view the overview dashboard on iPhone (Click here)
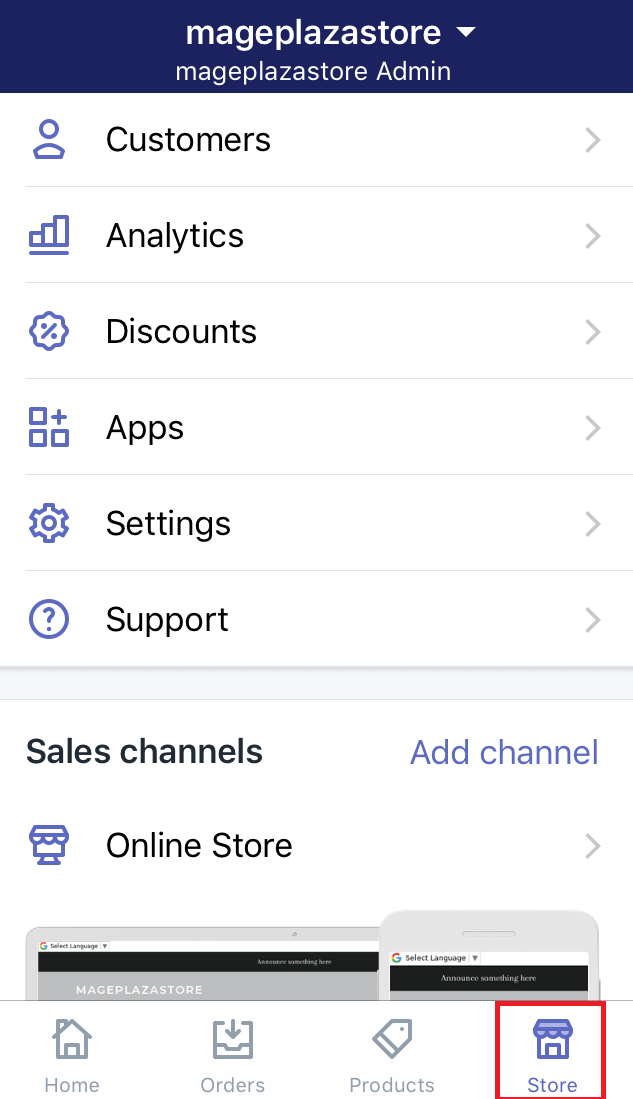
- Step 1: Go to Store
After logging in your Shopify account in the app, go to theStoresection at the bottom of the screen.
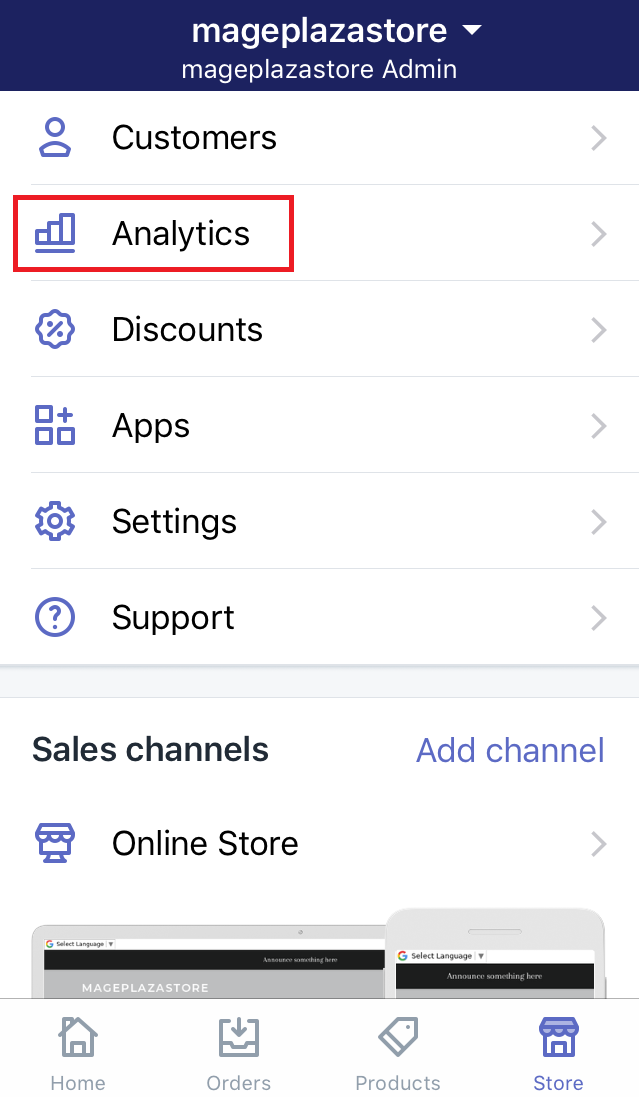
- Step 2: Click Analytics
Afterward, select Analytics. Then, the overview dashboard will come out. The dashboard is defaulted to show the data for the current day compared to the previous day
- Step 3: Select the date range
As I mentioned in the second step, the date is set by default. Hence, you may want to see the dashboard in a different date range. To do this, you can choose a preset range, for example, you select Last 7 days.
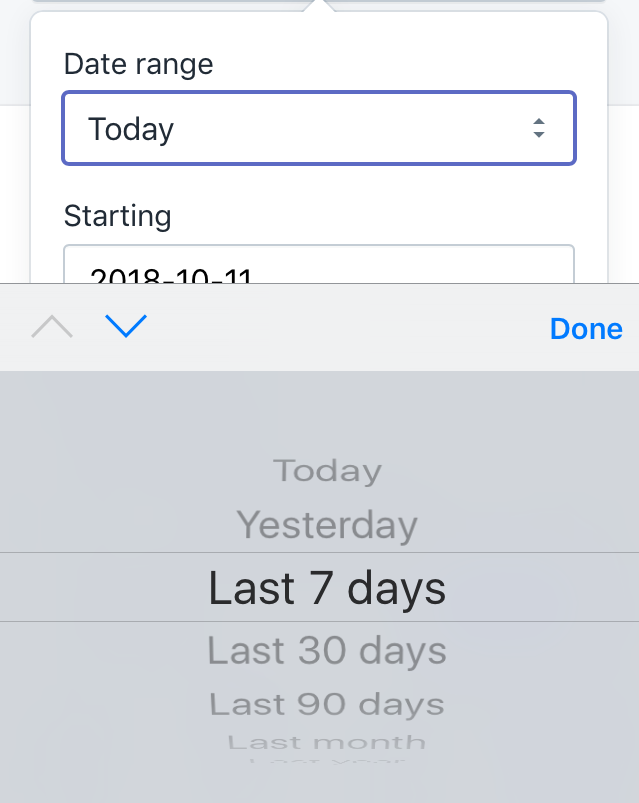
Or else, you customize the range by selecting dates on the calendars.
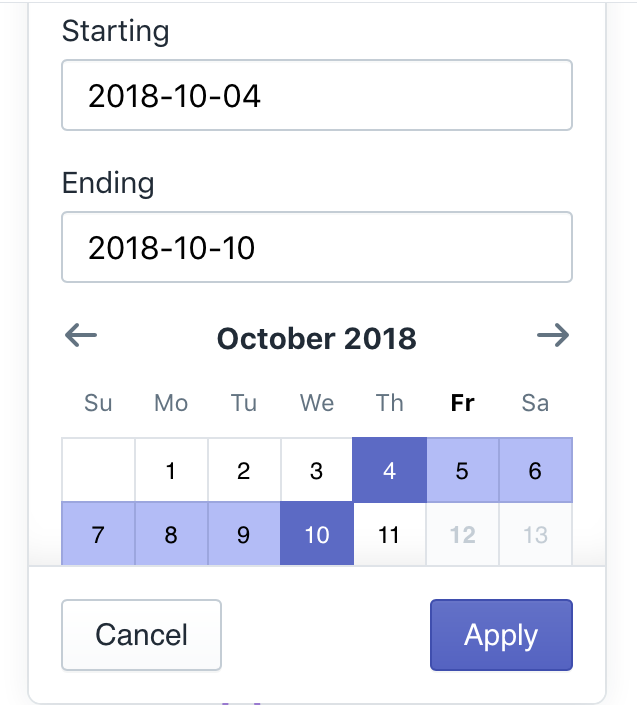
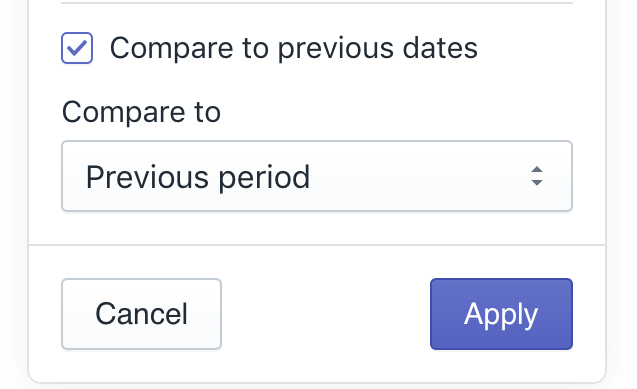
- Step 4: Check Compare to previous dates
In this step, Shopify provides you with a helpful feature to compare the recent sales and the previous ones. If you prefer to compare the current sales to the previous period or the same date range in the previous year, make sure to checkCompare to previous datesand choose the value of comparison.
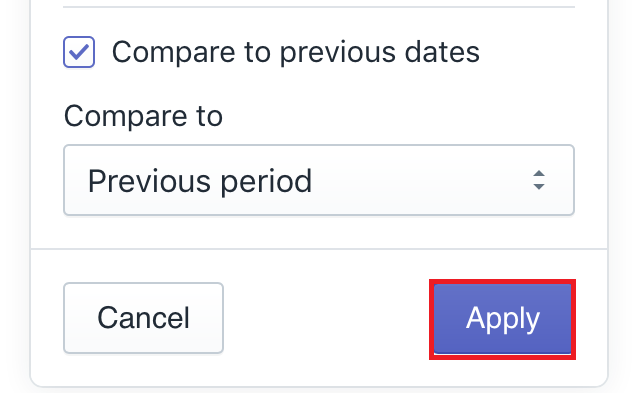
- Step 5: Click Apply
Afterward, click onApplyto view all the most valuable metrics which are shown in numeric format and graphs.
- Step 6: Optional
Click on theView reportbutton to access the detailed report for a specific metric.
To view the overview dashboard on Android (Click here)
-
Step 1: Go to Store
After logging in your Shopify account in the app, go to theStoresection at the bottom of the screen. -
Step 2: Click Analytics
Afterward, select Analytics. Then, the overview dashboard will come out. The dashboard is defaulted to show the data for the current day compared to the previous day -
Step 3: Select the date range
As I mentioned in the second step, the date is set by default. Hence, you may want to see the dashboard in a different date range. To do this, you can choose a preset range, for example, you select Last 7 days. Or else, you customize the range by selecting dates on the calendars. -
Step 4: Check Compare to previous dates
In this step, Shopify provides you with a helpful feature to compare the recent sales and the previous ones. If you prefer to compare the current sales to the previous period or the same date range in the previous year, make sure to checkCompare to previous datesand choose the value of comparison. -
Step 5: Click Apply
Afterward, click onApplyto view all the most valuable metrics which are shown in numeric format and graphs. -
Step 6: Optional
Click on theView reportbutton to access the detailed report for a specific metric.
Summary
After following this guide about How to view the overview dashboard on Shopify, we hope that you will find it a little bit easier to do your research. Like we said at the beginning of this post, the overview dashboard is something that you always want to keep your eyes on if you want to keep track of where your business is going. Of course, there are many other reports that you should pay attention to, and if you want to learn more about that, checkout our tutorials on Report and Analytics.
Related Posts:


